2018—2022年佳木斯市城乡饮用水水质变化趋势分析
作者: 蒋一 路子春 王艳旭 刘翠玉 胡钟颖 刘冰冰
Analysis of the Changing Trends in the Quality of Urban and Rural Drinking Water in Jiamusi City from 2018 to 2022
JIANG Yi1,LU Zichun1*,WANG Yanxu1,LIU Cuiyu', HU Zhongying1,LIU Bingbing (1.Jiamusi Center for Disease Control and Prevention, Jiamusi 154oo7, China; 2.School of Public Health, Jiamusi University, Jiamusi 1540o7, China)
Abstract: Objective: To analyze the trend of changes in drinking water quality in urban and rural areas of Jiamusi city from 2018 to 2022,evaluate its hygiene status and influencing factors,and provide scientific basis for optimizing water supply management. Method: Based on data from 1 609 monitoring points in 10 counties (cities)and districts ofJiamusi city from 2018 to 2022,analyze the qualified rateofurban and rural drinking water, the qualified rate of main monitoring indicators,and their changing trends.Result:From 2018 to 2022,a total of 3 218 water samples were monitored in Jiamusi city,including 2 923qualified water samples,with an average total qualified rate of 90.83% .the qualified rate of drinking water in rural areas (95.42%) is significantly higher than that in urban areas (78.21% ) (χ2=224.042 , P<0.001 ); there was no significant difference in the pass rate between the wet season (91.17%) and the dry season (90.50%) ) (χ2=0.437 0 P=0.509 ); the qualified rate of factory water (93.43% ) is the highest among all stages, and the difference between groups is statistically significant (χ2=16.866,P<0.001) Among the mainunqualified indicators,thequalifiedrates ofiron,manganese,turbidity,visible substances,ammonia nitrogen, and free residual chlorine were significantly improved (P<0.001 ).Conclusion: The drinking water qualityin Jiamusi cityhas significantly improved,but attntion stillneeds to bepaid tourban-rural differences, terminal water in the pipeline network,and water quality stability during the dry season.Suggest strengthening the maintenance of rural water supply networks,optimizing disinfection strategies,and exploring intellgent monitoring technologies to further improve management levels.
Keywords: drinking water quality; health surveillance; analysis of results; trends of change
饮用水卫生状况是保障公众身体健康、维系社会稳定的基础性要素,其质量优劣直接关系到介水传染病的防控效果以及慢性健康风险的规避能力。持续提升生活饮用水卫生质量,是公共卫生领域保障公众健康福祉的关键举措[1。近年来,佳木斯市积极响应国家饮水安全政策,通过系统性推进城乡饮水安全巩固提升工程,显著强化了饮用水水源保护、供水设施升级改造以及污染防治的综合治理力度。为科学评估这些措施的实际成效,并精准把握区域饮用水水质的变化规律,本研究基于佳木斯市2018—2022年连续5年的城乡饮用水水质监测数据,对该地区生活饮用水水质的动态变化趋势进行深入且系统的分析。
本文为全文原貌 未安装PDF浏览器用户请先下载安装
原版页码:shia20250634.pd原版全文
1材料与方法
1.1样品采集
2018一2022年在佳木斯市辖区的城市和农村地区进行样品采集,采样方式为随机布点采样[2]。
水样的采集、保存、运输和检验等过程按相关标准执行[3]。
1.2 检测项目与判定标准
水样监测类型包括地区(农村、城市)、水期(枯水期、丰水期)和供水环节(出厂水、末梢水、二次供水)。依据《生活饮用水卫生标准》(GB5749—2006),对所有监测水样进行水质常规指标(放射性指标不要求)、氨氮及可能存在风险特定指标的监测[4]。根据GB 5749—2006中的卫生要求,对水样进行卫生学评价,若水样中任一检测指标不符合标准,则判定该水样的卫生状况不合格[5]。
1.3 统计学分析
数据处理与分析使用Excel2023、SPSS27.0软件。统计描述采用频数和率,统计分析运用 χ2 检验、趋势性 χ2 检验。检验水准设定为 a=0.05 , P<0.05 认为差异具有统计学意义[
2结果与分析
2.1佳木斯市城乡饮用水水质总体情况
2.1.1城乡饮用水监测情况
城乡饮用水监测点的设置涵盖了市政供水(包括出厂水、末梢水、二次供水)农村小型集中式供水(出厂水、末梢水)等。2018—2022年,全市10个县(市)、区共设置1609个监测点,其中城市地区429个,农村地区1180个。
2.1.2 城乡饮用水水质监测情况
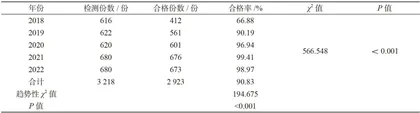
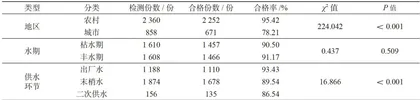
由表1可知,2018—2022年共采集水样3218份,其中合格样本为2923份,平均总合格率为90.83% 。不同年份间的饮用水合格率差异有统计学意义( χ2=566.548 , P<0.001 )。进一步分析不同采样地区、水期、供水环节对饮用水合格率的影响。由表2可知,农村饮用水合格率显著高于城市( x2=224.042 , P<0.001 );丰水期合格率与枯水期,无显著差异( χ2=0.437 , P=0.509 );出厂水合格率在各环节中最高,组间差异有统计学意义( χ2=16.866 P<0.001 )。
2.2佳木斯市城乡饮用水水质变化趋势
2.2.1总体合格率变化趋势
由表1可知,2018年合格率最低,为 66.88% 而2021年合格率最高,为 99.41% 。趋势性检验结果显示,2018—2022年水质综合达标率(除2022年水质综合达标率较2021年略微下降 0.44% 外)总体趋势呈显著上升( χ2=194.675 , P<0.001 ),表明城乡供水质量持续得到优化。

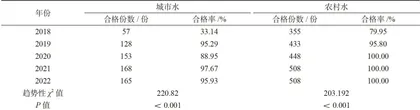
通过比较不同采样地区、水期、供水环节对饮用水合格率的影响,发现饮用水卫生质量呈现显著时空异质性。具体而言,城市供水合格率为 33.14%~97.67% ,农村供水合格率为79.95%~ 100.00% (见表3);在季节性波动中,枯水期和丰水期的合格率分别在 62.66%~99.41% 和71.10%~99.41% (见表4);在供水环节方面,出厂水( 79.46%~99.22% )、末梢水( 60.00%~99.49% )及二次供水( 56.25%~ 100.00% )的合格率(除2022年出厂水、末梢水合格率较2021年分别略微下降 0.79% 、 0.25% 外)均呈现同步改善态势(见表5),且各环节趋势性差异均有统计学意义( P<0.001 )。
2.2.2城乡饮用水主要不合格指标变化趋势
2018—2022年佳木斯市城乡饮用水水质的主要不合格指标包括铁、锰、色度、浑浊度、肉眼可见物、 pH 值、氟化物、耗氧量、氨氮和游离余氯,上述各项指标合格率均未达到 100% ,其平均合格率分别为 99.25% 、 96.89% 、 99.91% 、 99.01% 、 99.88% 、99.88% 、 99.91% 、 99.81% 、 98.57% 和 96.52% 。进一步分析显示,在未完全合格的指标中,铁( 96.75%~ 100.00% )、锰( 85.39%~ 100.00% )、浑浊度( 97.08%~ 100.00% )肉眼可见物( 99.68% \~100.0% )、氨氮( 92.53%~ 100.00% )的合格率均呈显著上升趋势( P<0.001 )。色度( 99.68% \~100.00% )、 pH 值( 99.36%~ 100.00% )、氟化物0 99.68%~ 100.00% )、耗氧量( 99.03%~ 100.00% )合格率虽有所提高,但其变化趋势未达统计学显著性水平( P>0.05 )。具体结果见表6。
本文为全文原貌 未安装PDF浏览器用户请先下载安装
原版页码:shia20250634.pd原版全文