渤海湾春、夏、秋浮游动物群落时空变化特征
作者: 张博伦 曾祥茜 郑德斌 侯纯强 王硕 张楠 李冰中图分类号: Q958.8 文献标志码:A 文章编号:1004-6755(2025)07—0006—07
DOI:10.3969/j.issn.1004-6755.2025.07.001
Spatiotemporal variation characteristics of the zooplankton community in Bohai Bay during Spring,Summer and Autumn
ZHANG Bolun 1,2 , ZENG Xiangxi1,², ZHENG Debin1,²,HOU Chunqiang1,² , WANG Shuo1,², ZHANG Nan1²,LI Bing³ (1.Tianjin Fisheries Research Institute,Tianjin 30o221,China;2.Tianjin MarineRanch TechnologyEnginering Center, Tianjin 3oo221,China;3.Tianjin Agricultural Development Service Center,Tianjin 30o61,China)
Abstract:To investigate the spatiotemporal distribution of the zooplankton community in Bohai Bay,a survey was conducted on zooplankton community characteristics in the coastal waters of Bohai Bay during spring(May),summer (August) and autumn (October) of 2O17. The results revealed significant seasonal variations in species composition,biomass,and other ecological features of the zooplankton. A total of 32 zooplankton species from 5 taxonomic groups were identified in this survey, including 12 species of copepods,11 species of larvae,5 species of cnidarians,3 species of amphipods, and1 species of chaetognaths. The species richness exhibited distinct seasonal variation,with the highest number of species recorded in spring(23 species),followed by autumn (18 species)and summer (16 species). The abundance and biomass of zooplankton followed a distinct seasonal gradient : spring(abundance 72ind./m3±88ind./m3 and biomass 390mg±503mg) ,summer(abundance 19 ind. /m3±20 ind. /  and biomass 177mg±266mg) ,autumn(abundance 7 ind./ ⟨m3±6 ind./ ′m3 and biomass 7mg±6mg .The abundance and biomass of zooplankton exhibited significant spatial variability across sampling stations,distribution pattern. Seasonal differences in zooplankton diversity indices were also pronounced:Shannon-Wiener diversity index ( H′) )and species richness index (D )followed the order:
spring > summer > autumn;evenness index(J) showed an inverse seasonal trend: autumn > summer > spring.
Key words:zooplankton; abundance; diversity index; seasonal variation; Bohai Bay
渤海湾属于渤海三大海湾之一,是一个典型的半封闭性海湾,是许多经济鱼虾类的产卵场和索饵场,对黄渤海的渔业经济意义重大 [1-2] 。作为海洋生态系统的重要类群,浮游动物通过捕食作用控制浮游植物的数量,同时作为鱼类等高层营养者的饵料3,其数量变化可以直接影响鱼类等的资源量,在海洋生态系统的结构和功能中起着重要的调控作用 [4-5] 。摸清浮游动物的群落结构特征及其季节变化规律对渔情预报及生态学等方面均具有重要意义,因此掌握浮游动物的群落生态特点是了解整个生态系统的关键[6-7]。本文于2017年春(5月)、夏(8月)、秋季(10月)在渤海湾近岸海区进行的浮游动物丰度和生物量调查,旨在为该海区浮游动物分布的长期变化、浮游生态系统的研究及渔业资源的发展提供基础数据,为相关学科研究提供基础的背景资料。
本文为全文原貌 未安装PDF浏览器用户请先下载安装
原版页码:hyby20250702.pd原版全文
1材料与方法
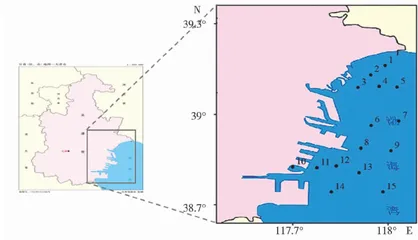
于2017年春季(5月)、夏季(8月)和秋季(10月)在渤海湾近岸海区进行了3次浮游动物监测调查,布设采样站位15个,见图1。采用网目大小为 0. 505mm ,网长、网口内径、网口面积分别为 1.45m,0.5m 和 0.2m2 的浅水I型浮游生物网由底到表垂直拖网,样品用中性甲醛溶液固定,加人量为样品体积的 5% 。在解剖镜(OlympusSZ61)下对样品进行种类鉴定和个体计数,以湿重法称取浮游动物的生物量。以上方法严格按照《海洋监测规范》进行。
根据徐兆礼等[8的公式计算优势度 (Y) ,公式如下:
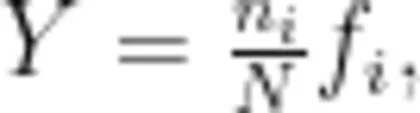
式中, ni 为第 i 种的个体数; N 为总个体数; fi 为第 i 种在各个站位出现的频率; Y>0.02 时,该种为优势种。
浮游动物群落的多样性采用Shannon一Wiener指数 (H′)[9] ,物种丰富度采用Margalef指数
(D)[10] ,均匀度采用Pielou指数 (J)[11] ,其公式分别如下:
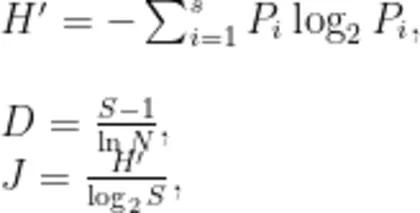
式中, s 为物种种类数; Pi 为第 i 种的个体数与总个体数的比值; N 为群落中所有个体数。
2 结果与分析
2.1 种类组成
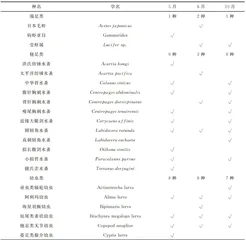
本次调查共鉴定发现浮游动物32种,分别隶属于5大类群。其中,桡足类12种,总物种数量占比最高,为 37.5% ;幼虫类11种(占比34.38% ),腔肠动物5种(占比 15.62% ),端足类3种(占比 9.38% ),毛颚类1种(占比 3.12%⟩ ,见表1。春季鉴定发现浮游动物物种数量最高,为5类群23种,以桡足类(9种, 39.13% )和幼虫类为主(8种, 34.78% ),此二类占比 73.91% ,季节性特有物种为9种;秋季鉴定发现浮游动物物种数量次之,为5类群18种,依然以桡足类(8种, 44.44% )、幼虫类(7种, 38.89% )为主要类别,此二类占比 83.33% ,季节性特有物种为2种;夏季鉴定发现浮游动物物种数量最少,为5类群16种,以幼虫类为主要类别,占比50.00% ,夏季季节性特有物种为3种,见表1。三个季节共有物种为7种,分别为圆唇角水蚤、阿利玛幼虫、短尾类蚤状幼虫、桡足类无节幼虫、长尾类幼虫、多毛类幼虫和强壮箭虫,占比21.88% 。

2.2 优势种组成
本次调查共发现优势种(优势度 Y⩾0. 02 )8种(类),其中强壮箭虫和短尾类蚤状幼虫在三个季节均成为优势种,见表2。春季共发现优势种5种(类),其中优势度最高的种(类)为强壮箭虫(0.28),之后依次为中华哲水蚤(0.19)、长尾类幼虫(0.13)、短尾类蚤状幼虫(0.06)、磁蟹蚤状幼虫(0.02);夏季共发现优势种5种,其中优势度最高的种(类)为球型侧腕水母(0.44),之后依次为长尾类幼虫(0.12)、强壮箭虫(0.07)、短尾类蚤状幼虫(0.05)和磁蟹蚤状幼虫(0.04);秋季共发现优势种4种,其中优势度最高的种(类)为强壮箭虫(0.44),之后依次为短尾类蚤状幼虫(0.03)、小拟哲水蚤(0.02)和圆唇角水蚤(0.02)。
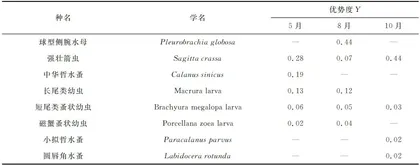
注:“—"表示优势度 Y<0.02 。
2.3丰度和生物量的时空变化
2.3.1 季节变化
如图2所示,调查海区浮游动物丰度和生物量在春、夏、秋三季间季节性差异显著( ⋅P<0.05 。浮游动物丰度和生物量均在春季达到最高值,在秋季降到最低值。
春季浮游动物丰度范围为 4~283 ind./ 'm3 ,平均值为 (72±88) ind./ 'm3 ,最小值出现在St.9站位,最大值出现在St.2站位;春季浮游动物生物量范围为 3~1727mg/m3 ,平均值为 (390±503)mg/m3 ,最小值出现在St.9站位,最大值出现在St.8站位。夏季浮游动物丰度范围为 3~81 ind./ m3 ,平均值为(19±20) ind./ 'm3 ,最小值出现在St.6站位,最大值出现在St.4站位;夏季浮游动物生物量范围为2~684mg/m3 ,平均值为 (177±266)mg/m3 ,最小值出现在St.6和St.15站位,最大值出现在St.4站位。秋季浮游动物丰度范围为 2~24 ind./  ,平均值为(7±6) ind. / ,最小值出现在St.8站位,最大值出现在St.2站位;秋季浮游动物生物量范围为2~25mg/m3 ,平均值为 (7±6)mg/m3 ,最小值出现在St.3,St.5,St.8和St.12站位,最大值出现在St.2站位。
本文为全文原貌 未安装PDF浏览器用户请先下载安装
原版页码:hyby20250702.pd原版全文